Nextjs is a production-ready React framework for building single-page web applications. It enables you to build fast and user-friendly static websites, as well as web applications using Reactjs. Using OpenTelemetry Nextjs libraries, you can set up end-to-end tracing for your Nextjs applications.
Nextjs has its own monitoring feature, but it is only limited to measuring the metrics like core web vitals and real-time analytics of the application. It doesn’t have end-to-end tracing, monitoring the database calls, etc. That’s where OpenTelemetry comes in.
OpenTelemetry is an open-source standard under the Cloud Native Computing Foundation (CNCF) used for instrumenting applications for generating telemetry data. You can monitor your Nextjs application using OpenTelemetry and a tracing backend of your choice.
What is OpenTelemetry Nextjs instrumentation? Instrumentation is the process of enabling your application code to generate telemetry data like logs, metrics, and traces. Using OpenTelemetry Nextjs client libraries, you can generate end-to-end tracing data from your Nextjs application.
OpenTelemetry provides client libraries to take care of instrumentation. You then need to send the collected data to an analysis backend. In this tutorial, we will be using SigNoz to store and visualize the telemetry data collected by OpenTelemetry from the sample Nextjs application.
Before we demonstrate how to implement the OpenTelemetry Nextjs libraries, let’s have a brief overview of OpenTelemetry.
What is OpenTelemetry?
OpenTelemetry is an open-source vendor-agnostic set of tools, APIs, and SDKs used to instrument applications to create and manage telemetry data(logs, metrics, and traces). It aims to make telemetry data(logs, metrics, and traces) a built-in feature of cloud-native software applications.
The telemetry data is then sent to an observability tool for storage and visualization.
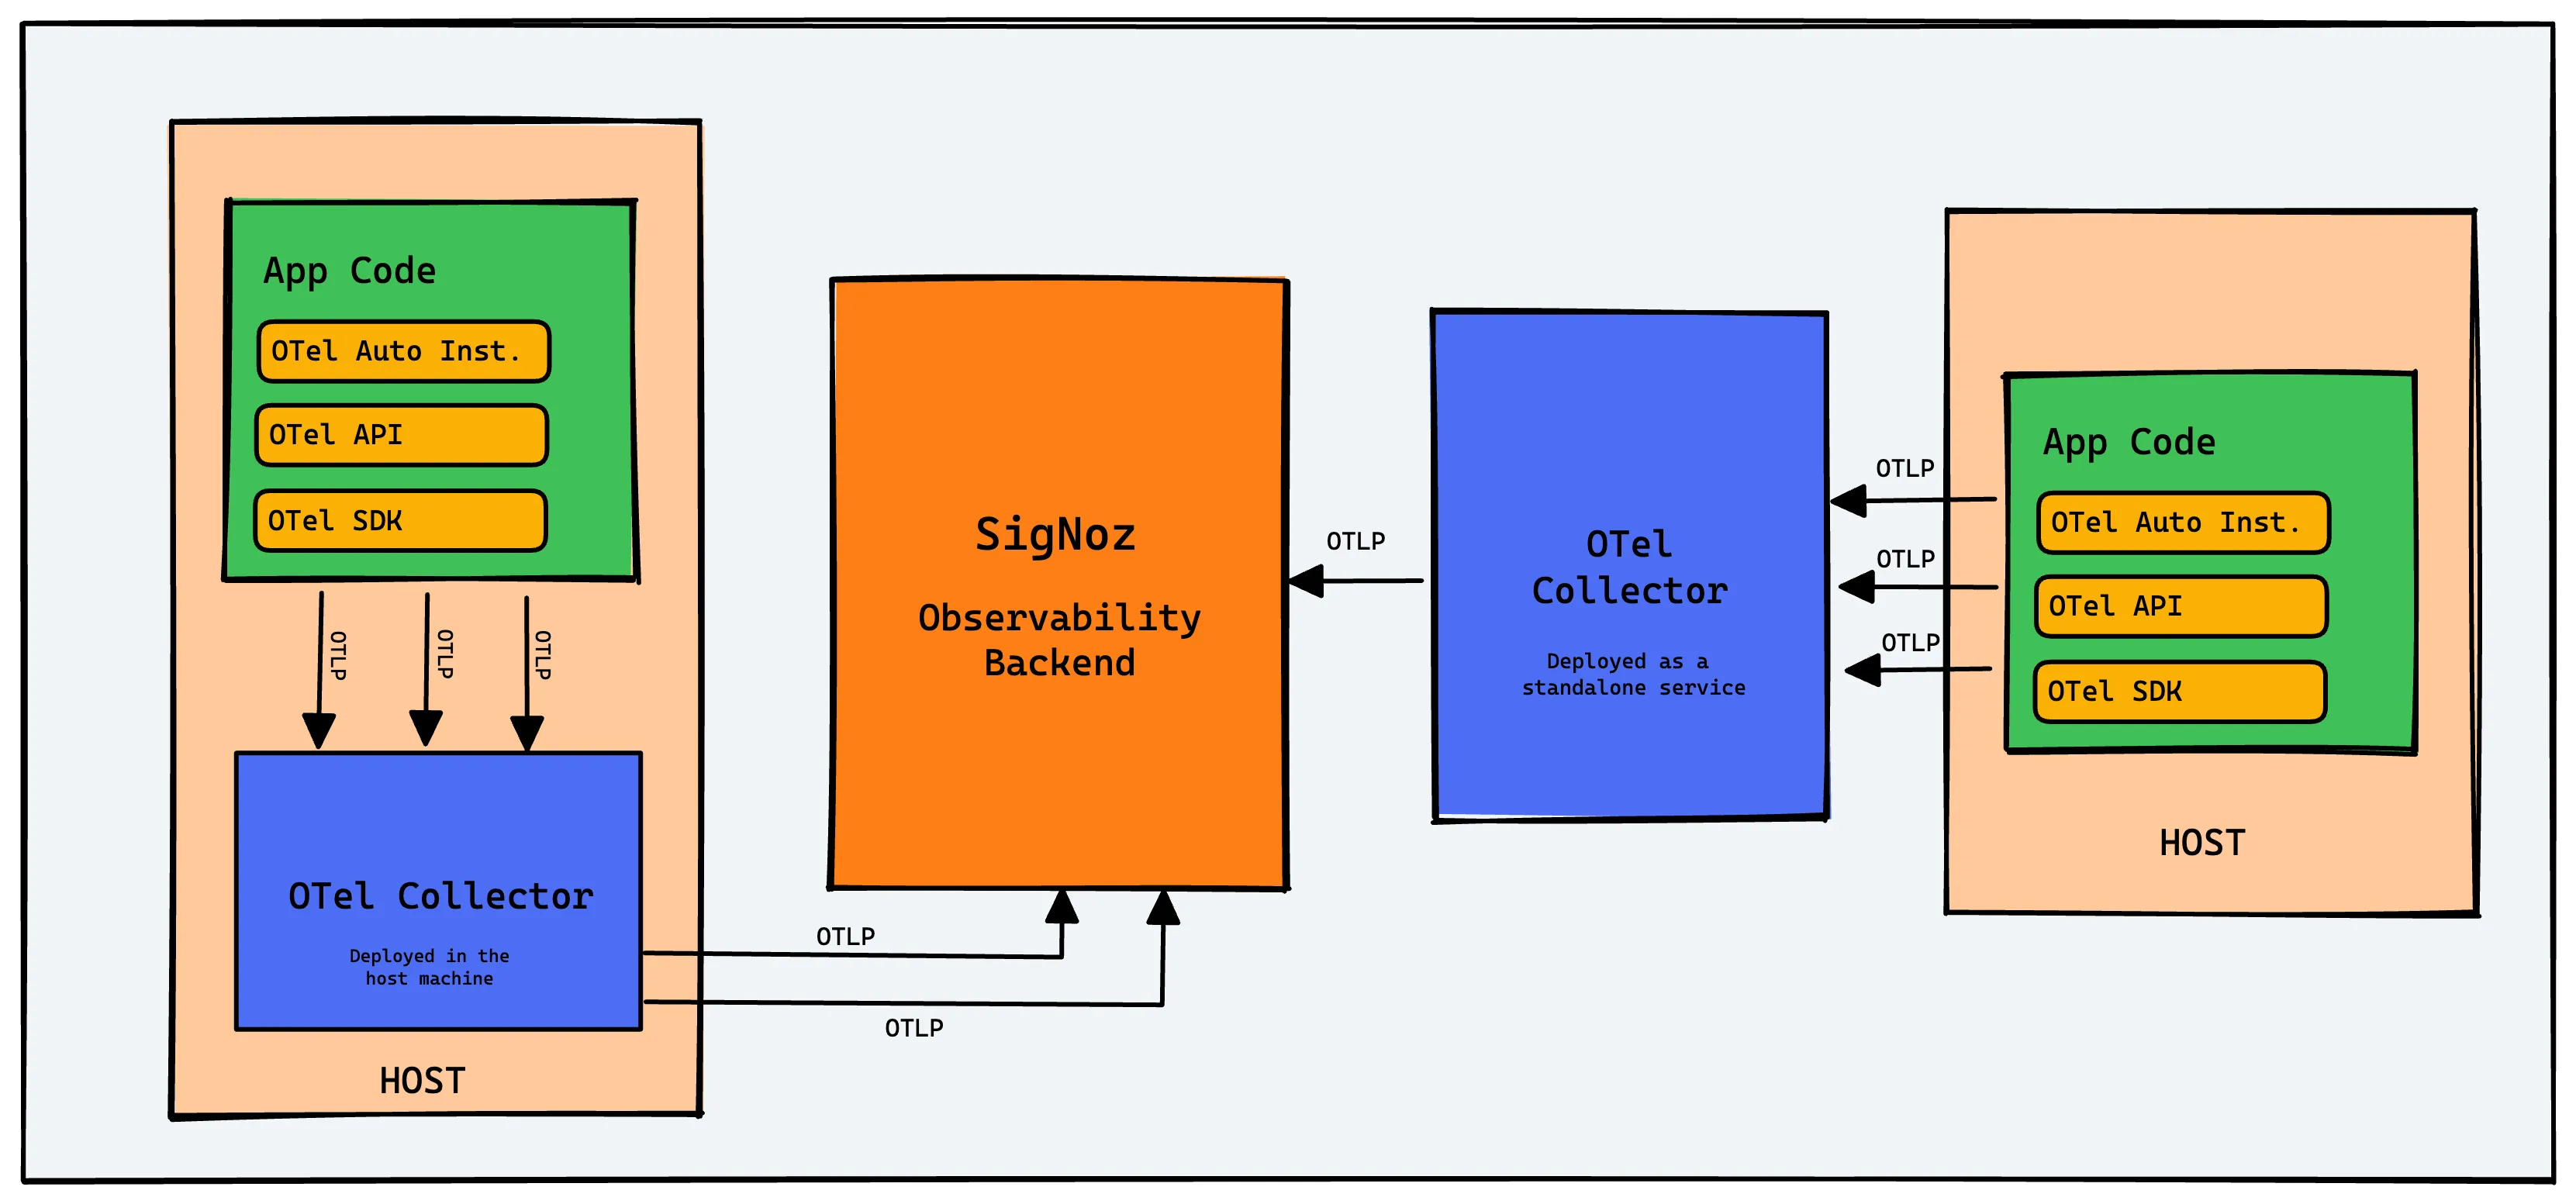
OpenTelemetry is the bedrock for setting up an observability framework. It also provides you the freedom to choose a backend analysis tool of your choice. You will never get locked in with any vendor if you use OpenTelemetry for your instrumentation layer.
OpenTelemetry and SigNoz
In this tutorial, we will use SigNoz as our backend analysis tool. SigNoz is a full-stack open-source APM tool that can be used for storing and visualizing the telemetry data collected with OpenTelemetry. It is built natively on OpenTelemetry and works on the OTLP data formats. SigNoz provides query and visualization capabilities for the end-user and comes with out-of-box charts for application metrics and traces.
Now let’s get down to how to implement OpenTelemetry Nextjs libraries for a sample Nextjs application and then visualize the collected data in SigNoz.
Creating a SigNoz cloud account
SigNoz cloud is the easiest way to run SigNoz. You can sign up here for a free account and get 30 days of unlimited access to all features.
After you sign up and verify your email, you will be provided with details of your SigNoz cloud instance. Once you set up your password and log in, you will be greeted with the following onboarding screen.
Creating a sample Nextjs application
Before instrumenting your application, you'll need a Next.js app to work with. If you already have one, you can skip to the next section. Otherwise, follow these steps to create a new Next.js application or check out the sample application at this GitHub repo.
Prerequisites
Node.js: Ensure you have Node.js 12.22.0 or later installed on your machine. You can verify your Node.js version by running:
node -vPackage Manager: You can use
npm,yarn, orpnpmas your package manager.
Steps to Create a New Next.js Application
To get started with building a Next.js application, follow these steps to quickly set up your project using the official create-next-app CLI tool. It automates the setup process, ensuring you have everything you need to begin developing.
Step 1: Create a New project
Use one of the following commands based on your preferred package manager:
Using
npxwith npm:npx create-next-app@latestUsing Yarn:
yarn create next-appUsing pnpm:
pnpm create next-app
Step 2: Follow the Interactive Prompts
The CLI will prompt you for information such as the project name, template selection, and whether to use TypeScript, ESLint, etc. Fill in the details as per your requirements.
Step 3: Navigate to the Project Directory:
cd your-project-name
Step 4: Start the Development Server
Use the appropriate command based on your package manager:
npm:
npm run devyarn
yarn devpnpm
pnpm dev
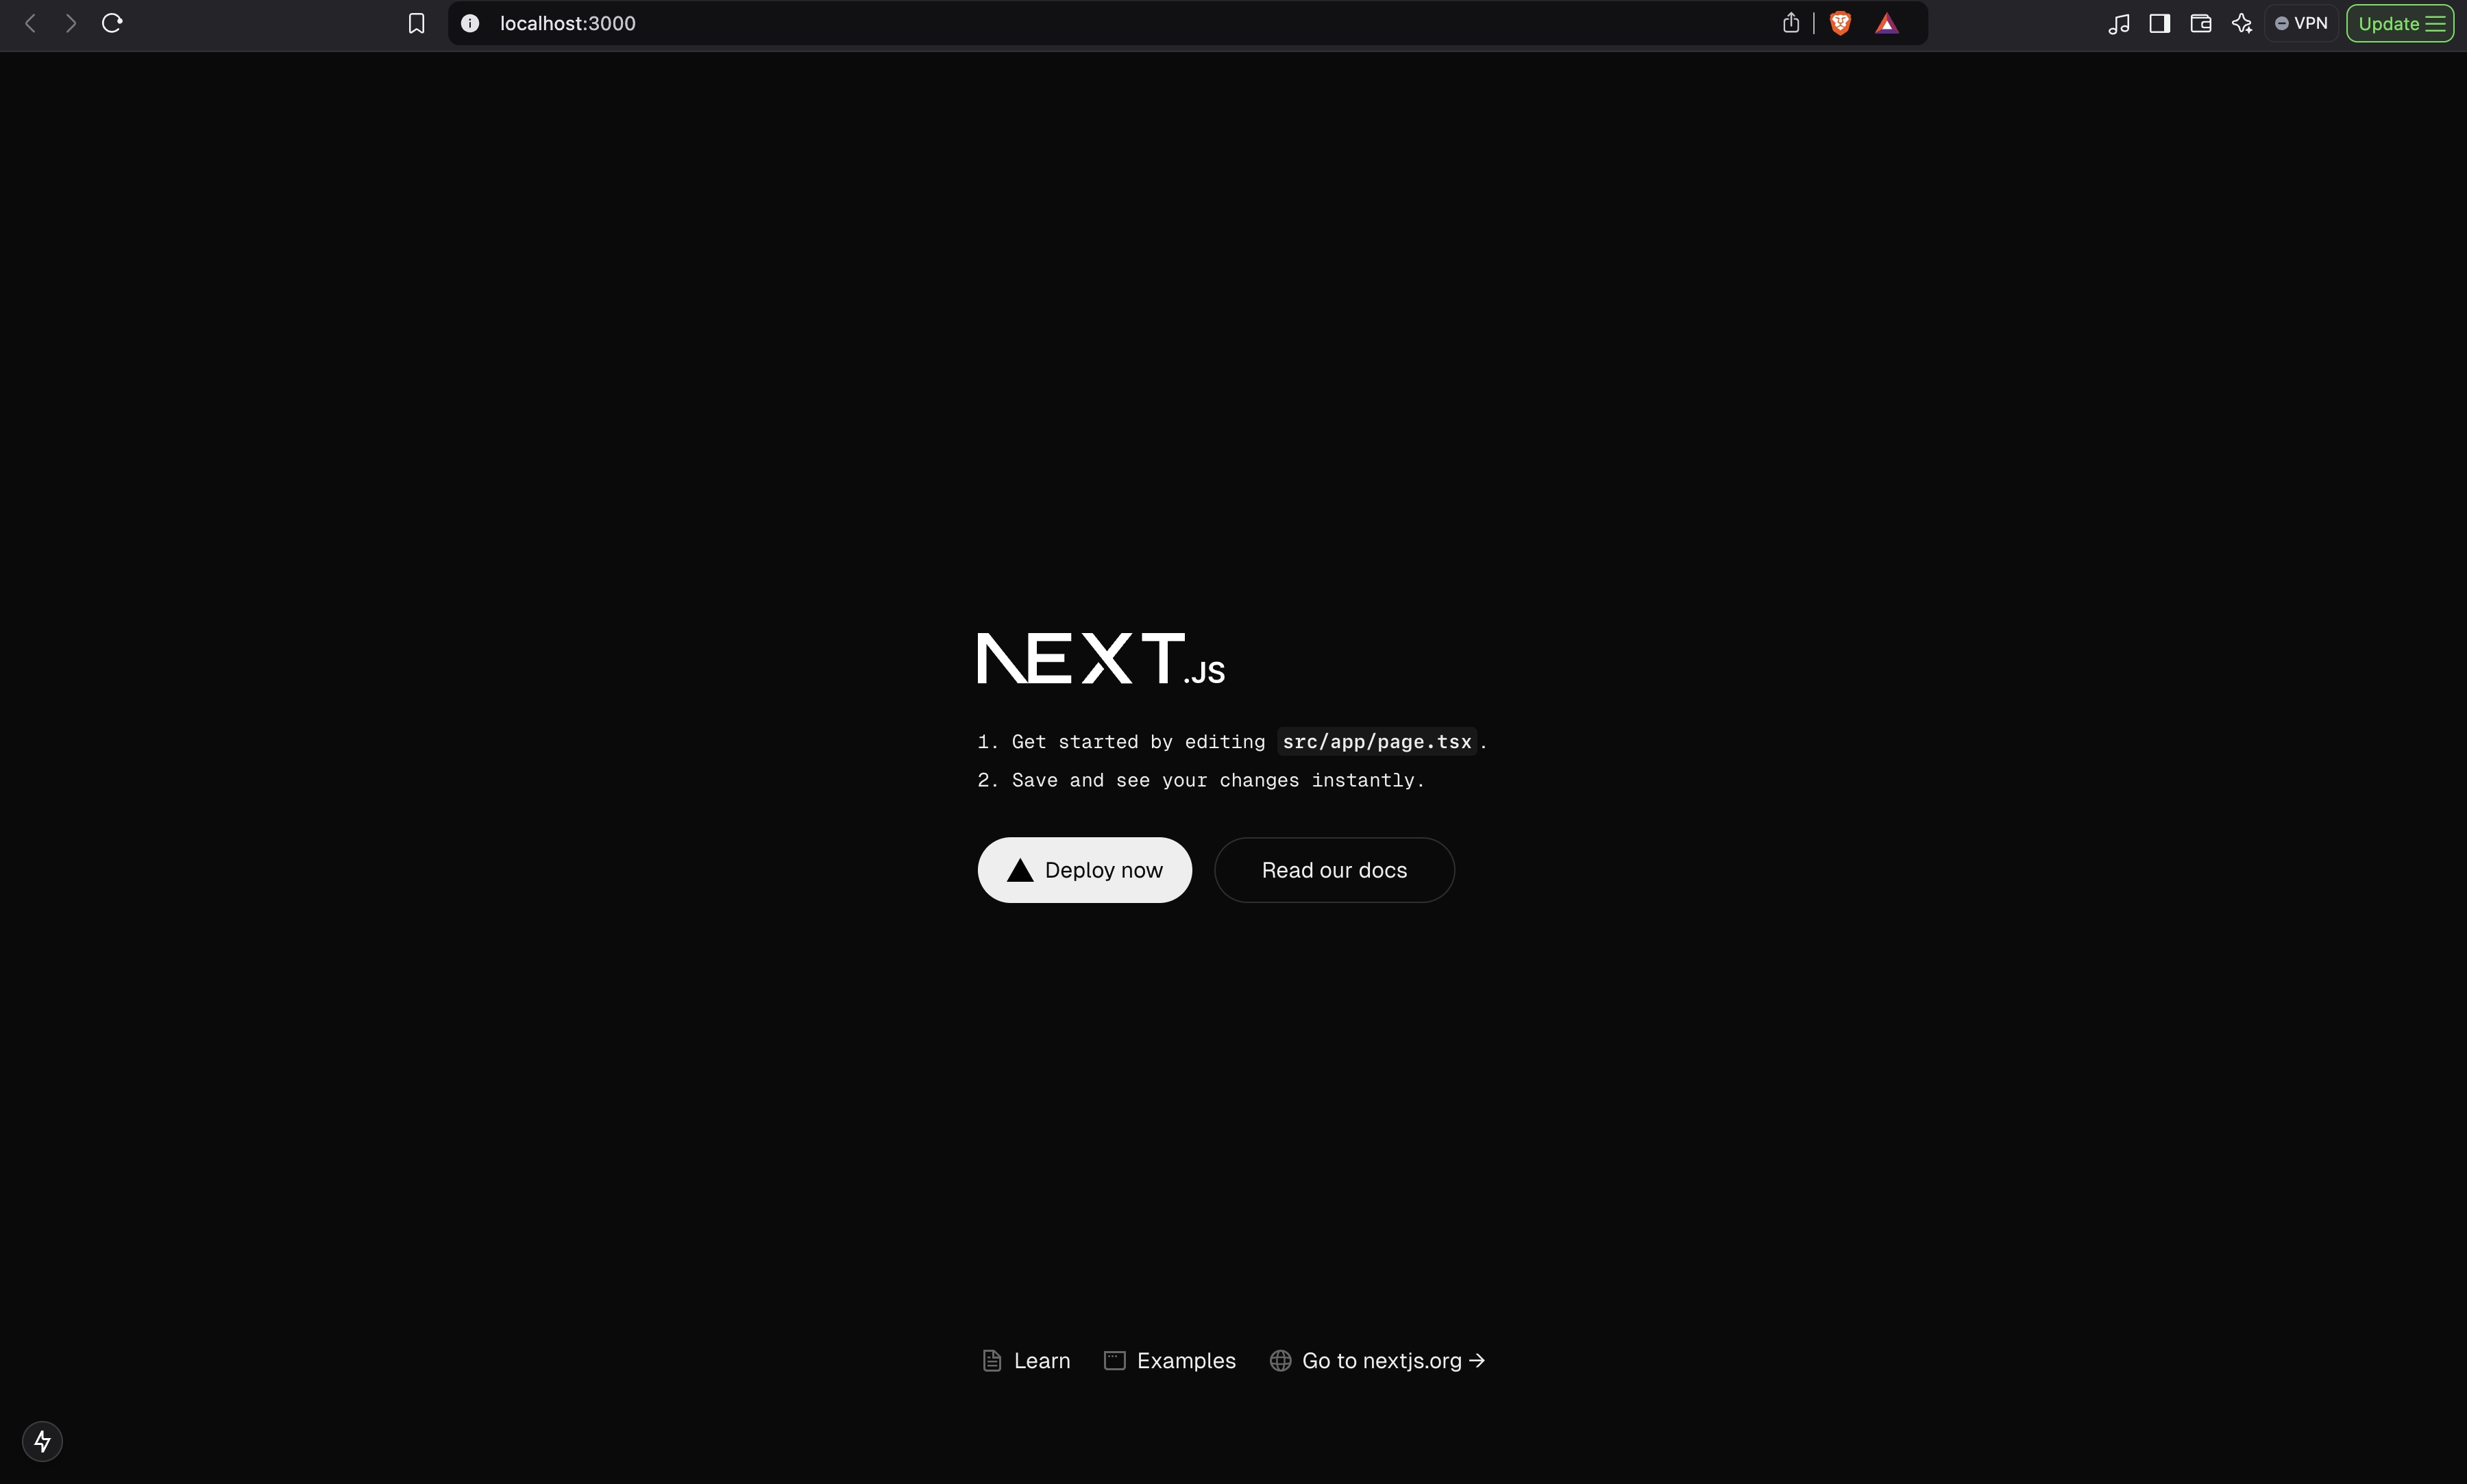
Step 5: Verify the Application is Running
Open your browser and navigate to http://localhost:3000. You should see the default Next.js welcome page.
Instrumenting the Nextjs application with OpenTelemetry
Instrumenting your application involves integrating OpenTelemetry libraries to collect telemetry data (metrics, logs, traces) and configuring exporters to send this data to SigNoz for analysis.
Step 1: Install Required Packages
Begin by installing the necessary OpenTelemetry and Vercel OTEL packages.
npm install @vercel/otel @opentelemetry/api
Where:
@vercel/otel: Vercel's OpenTelemetry integration package.@opentelemetry/api: Core OpenTelemetry API package.
Alternative with Yarn or pnpm:
If you prefer using Yarn or pnpm, replace npm install with yarn add or pnpm add
This step is only needed when using NextJs 14 and below
Step 2. Update next.config.mjs to include instrumentationHook
/** @type {import('next').NextConfig} */
const nextConfig = {
    // include instrumentationHook experimental feature
    experimental: {
        instrumentationHook: true,
    },
};

export default nextConfig;
Step 3. Create instrumentation.ts file
Create another file named instrumentation.ts at the root of your project. This file registers the OpenTelemetry instrumentation with Vercel's OTEL integration.
import { registerOTel, OTLPHttpJsonTraceExporter } from '@vercel/otel';
// Add otel logging
import { diag, DiagConsoleLogger, DiagLogLevel } from '@opentelemetry/api';
diag.setLogger(new DiagConsoleLogger(), DiagLogLevel.ERROR); // set diaglog level to DEBUG when debugging

export function register() {
  registerOTel({
    serviceName: '<service_name>',
    traceExporter: new OTLPHttpJsonTraceExporter({
        url: 'https://ingest.<region>.staging.signoz.cloud:443/v1/traces', // Set to http://localhost:4318/v1/traces if you are exporting to OTel collector or self-hosted SigNoz
        headers: { 'signoz-ingestion-key': '<your-ingestion-key>' }, // Set only if you are exporting to SigNoz Cloud directly
    }),
  });
}
Diagnostics Configuration:
diag.setLogger(new DiagConsoleLogger(), DiagLogLevel.ERROR);: Sets up a console logger for OpenTelemetry diagnostics. TheDiagLogLevel.ERRORensures that only error messages are logged. For debugging purposes, you can set this toDiagLogLevel.DEBUGto receive more verbose logs.
Exporter Options:
url: The endpoint where trace data will be sent. The full URL format ishttps://ingest.[region].signoz.cloud:443/v1/traces. Depending on the choice of your region for SigNoz cloud, the ingest endpoint will vary according to this table.Region Endpoint US ingest.us.signoz.cloud:443/v1/traces IN ingest.in.signoz.cloud:443/v1/traces EU ingest.eu.signoz.cloud:443/v1/traces headers: Contains thesignoz-ingestion-keys, which is your SigNoz ingestion key. This key authenticates your application with SigNoz and ensures that data is sent securely. If you haven't created one yet, you can follow this guide to generate your ingestion key.
registerOTel: A function provided by@vercel/otelthat initializes OpenTelemetry with the given configurations.<service_name>: A unique name for your application. This name will appear in the SigNoz dashboard, helping you identify traces from different services.
💡 Note: Ensure that instrumentation.ts are placed in the root directory of your project. If you use a src folder, place them inside src alongside other directories like pages and app. You can also check the sample application at this GitHub repo.
Step 5. Run and Validate
Once you're done configuring the exporter options, try running your application and validate if your application is sending traces to SigNoz cloud here.
npm
npm run devyarn
yarn devpnpm
pnpm dev
Generate Telemetry Data
To begin generating telemetry data for analysis, open your browser and navigate to http://localhost:3000. Ensure that your application is running and accessible.
Hit the URL a couple of times to generate some dummy data which can later be visualized and monitored in SigNoz.
Monitoring your Application in SigNoz
Once your Next.js application is instrumented and running and telemetry data is being generated, the next step is to validate that this data is being received in SigNoz and begin monitoring your application's performance.
To get started, log in to your SigNoz cloud account. Under the Services tab on the SigNoz dashboard, you should see your application listed among other services.
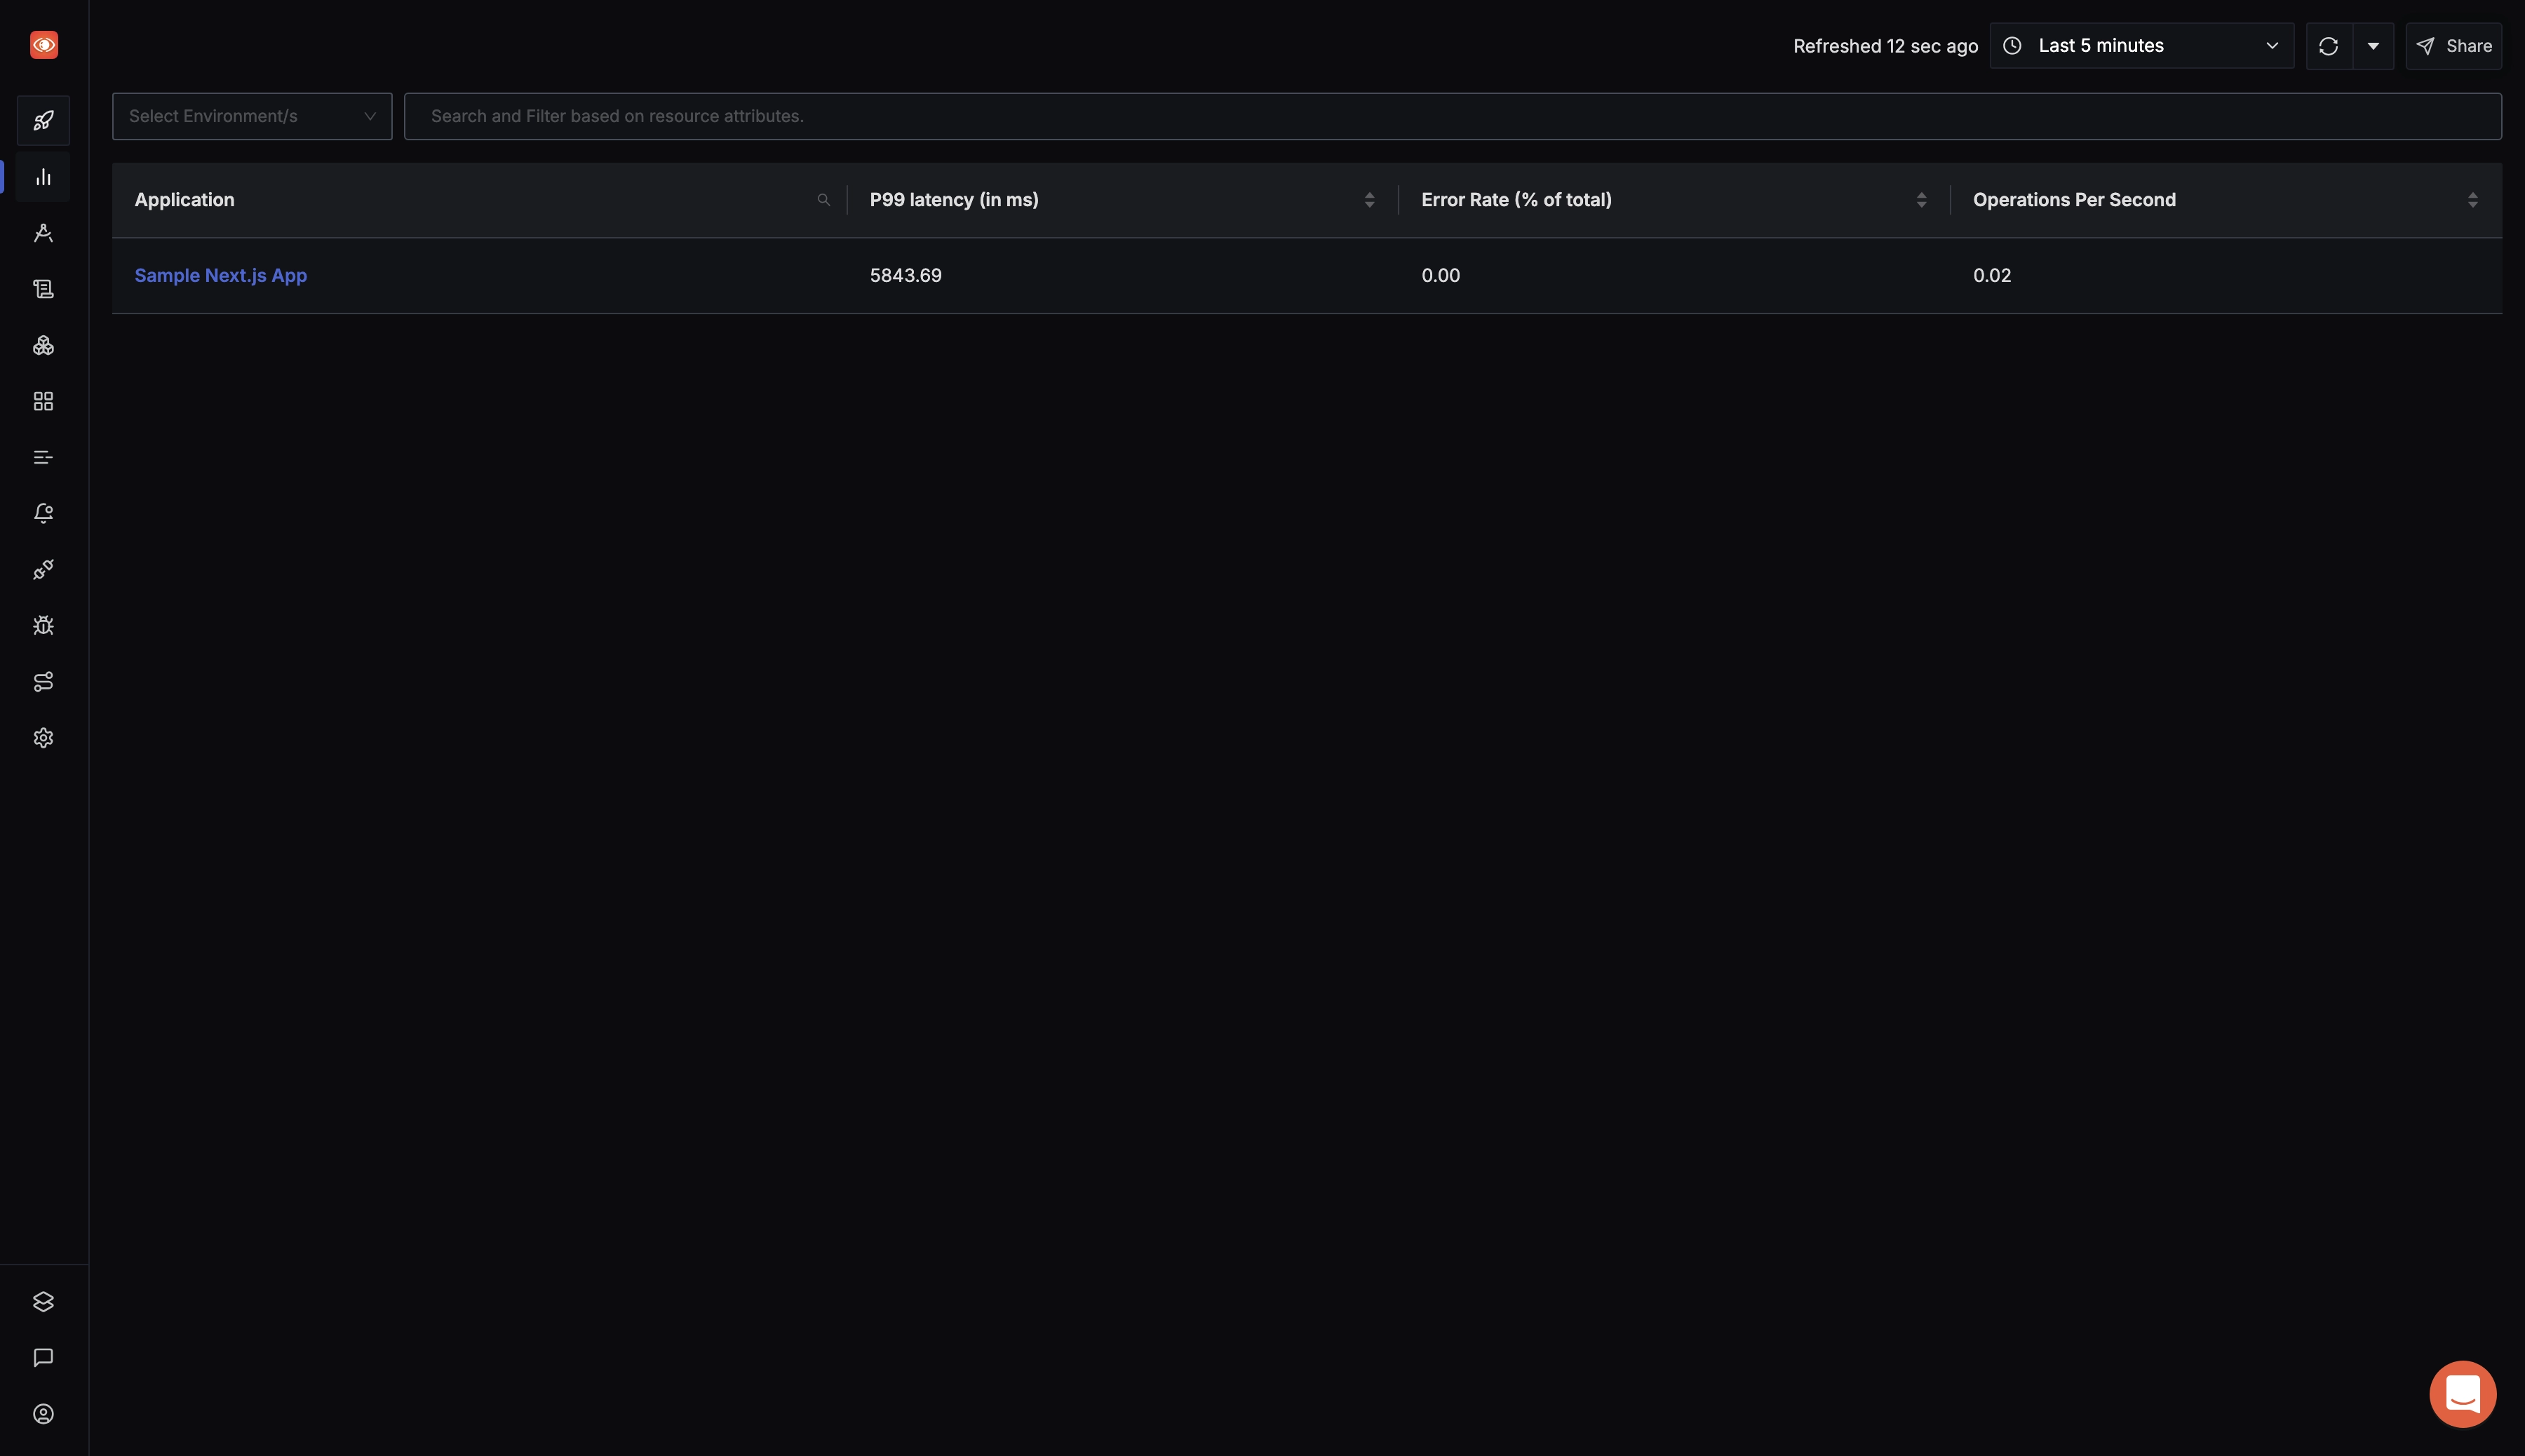
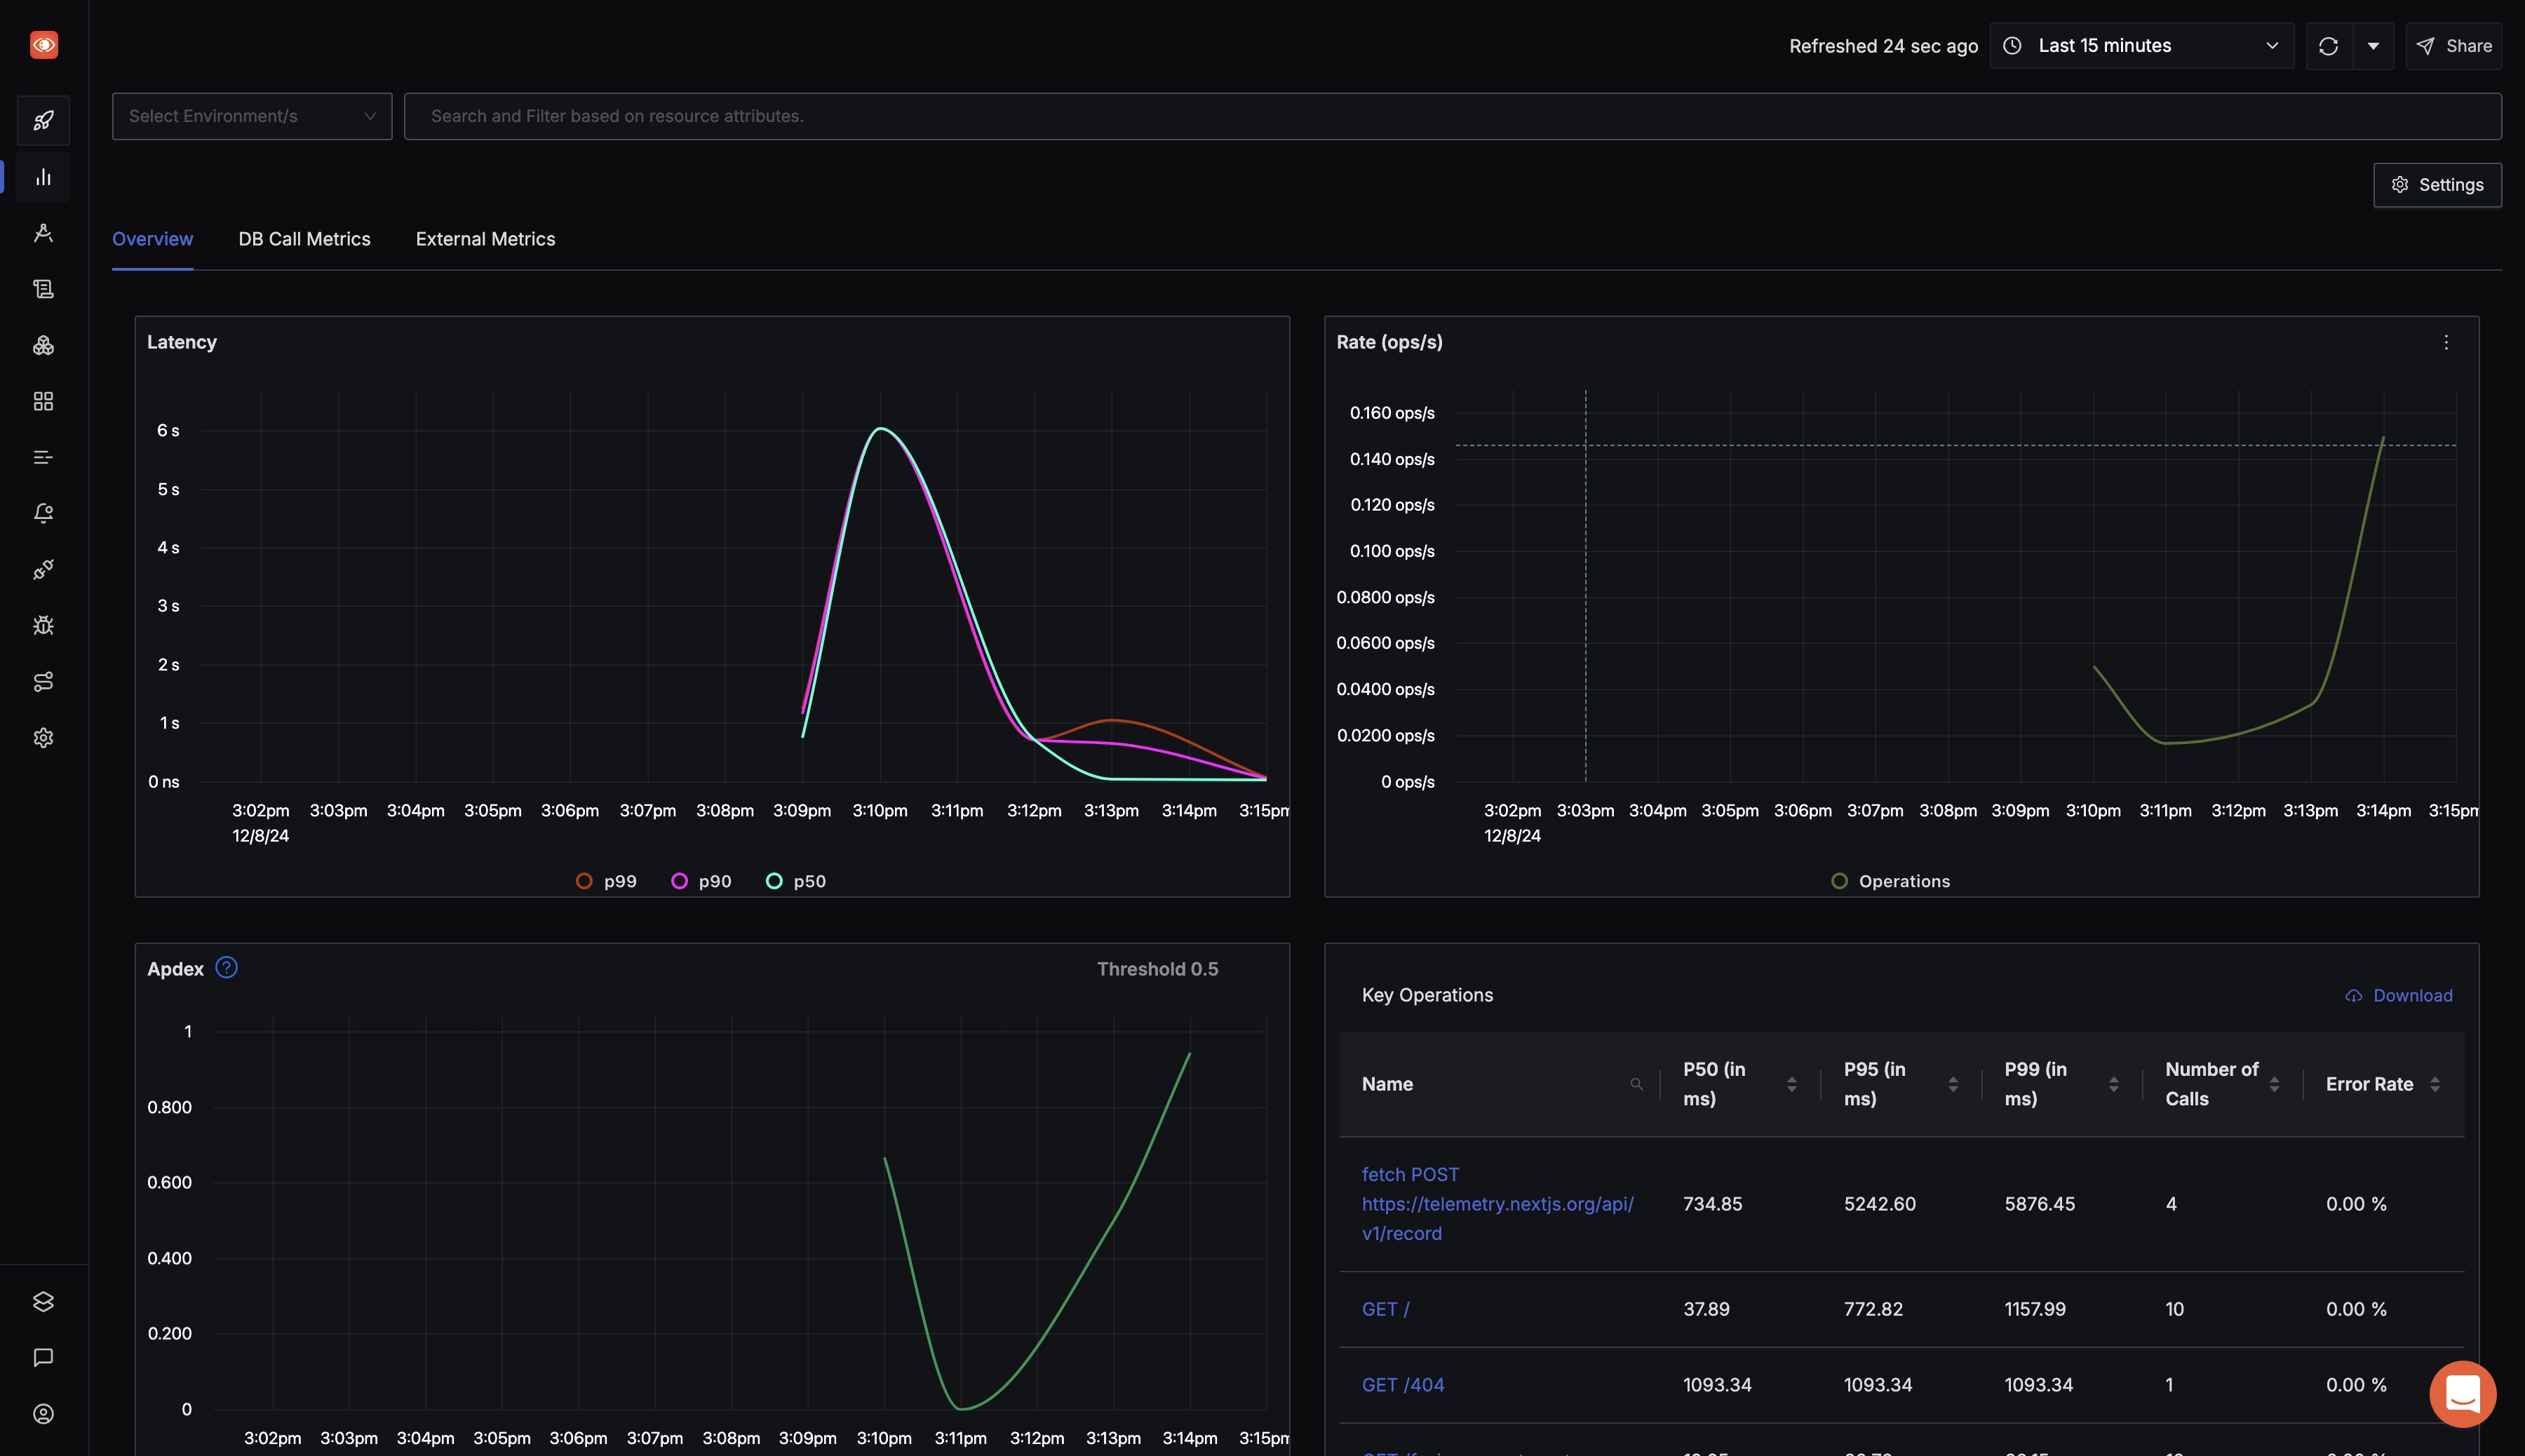
Click on your application to access the Metrics page. This page provides out-of-the-box, pre-built dashboards displaying critical application metrics such as application latency, requests per second, and error percentages.
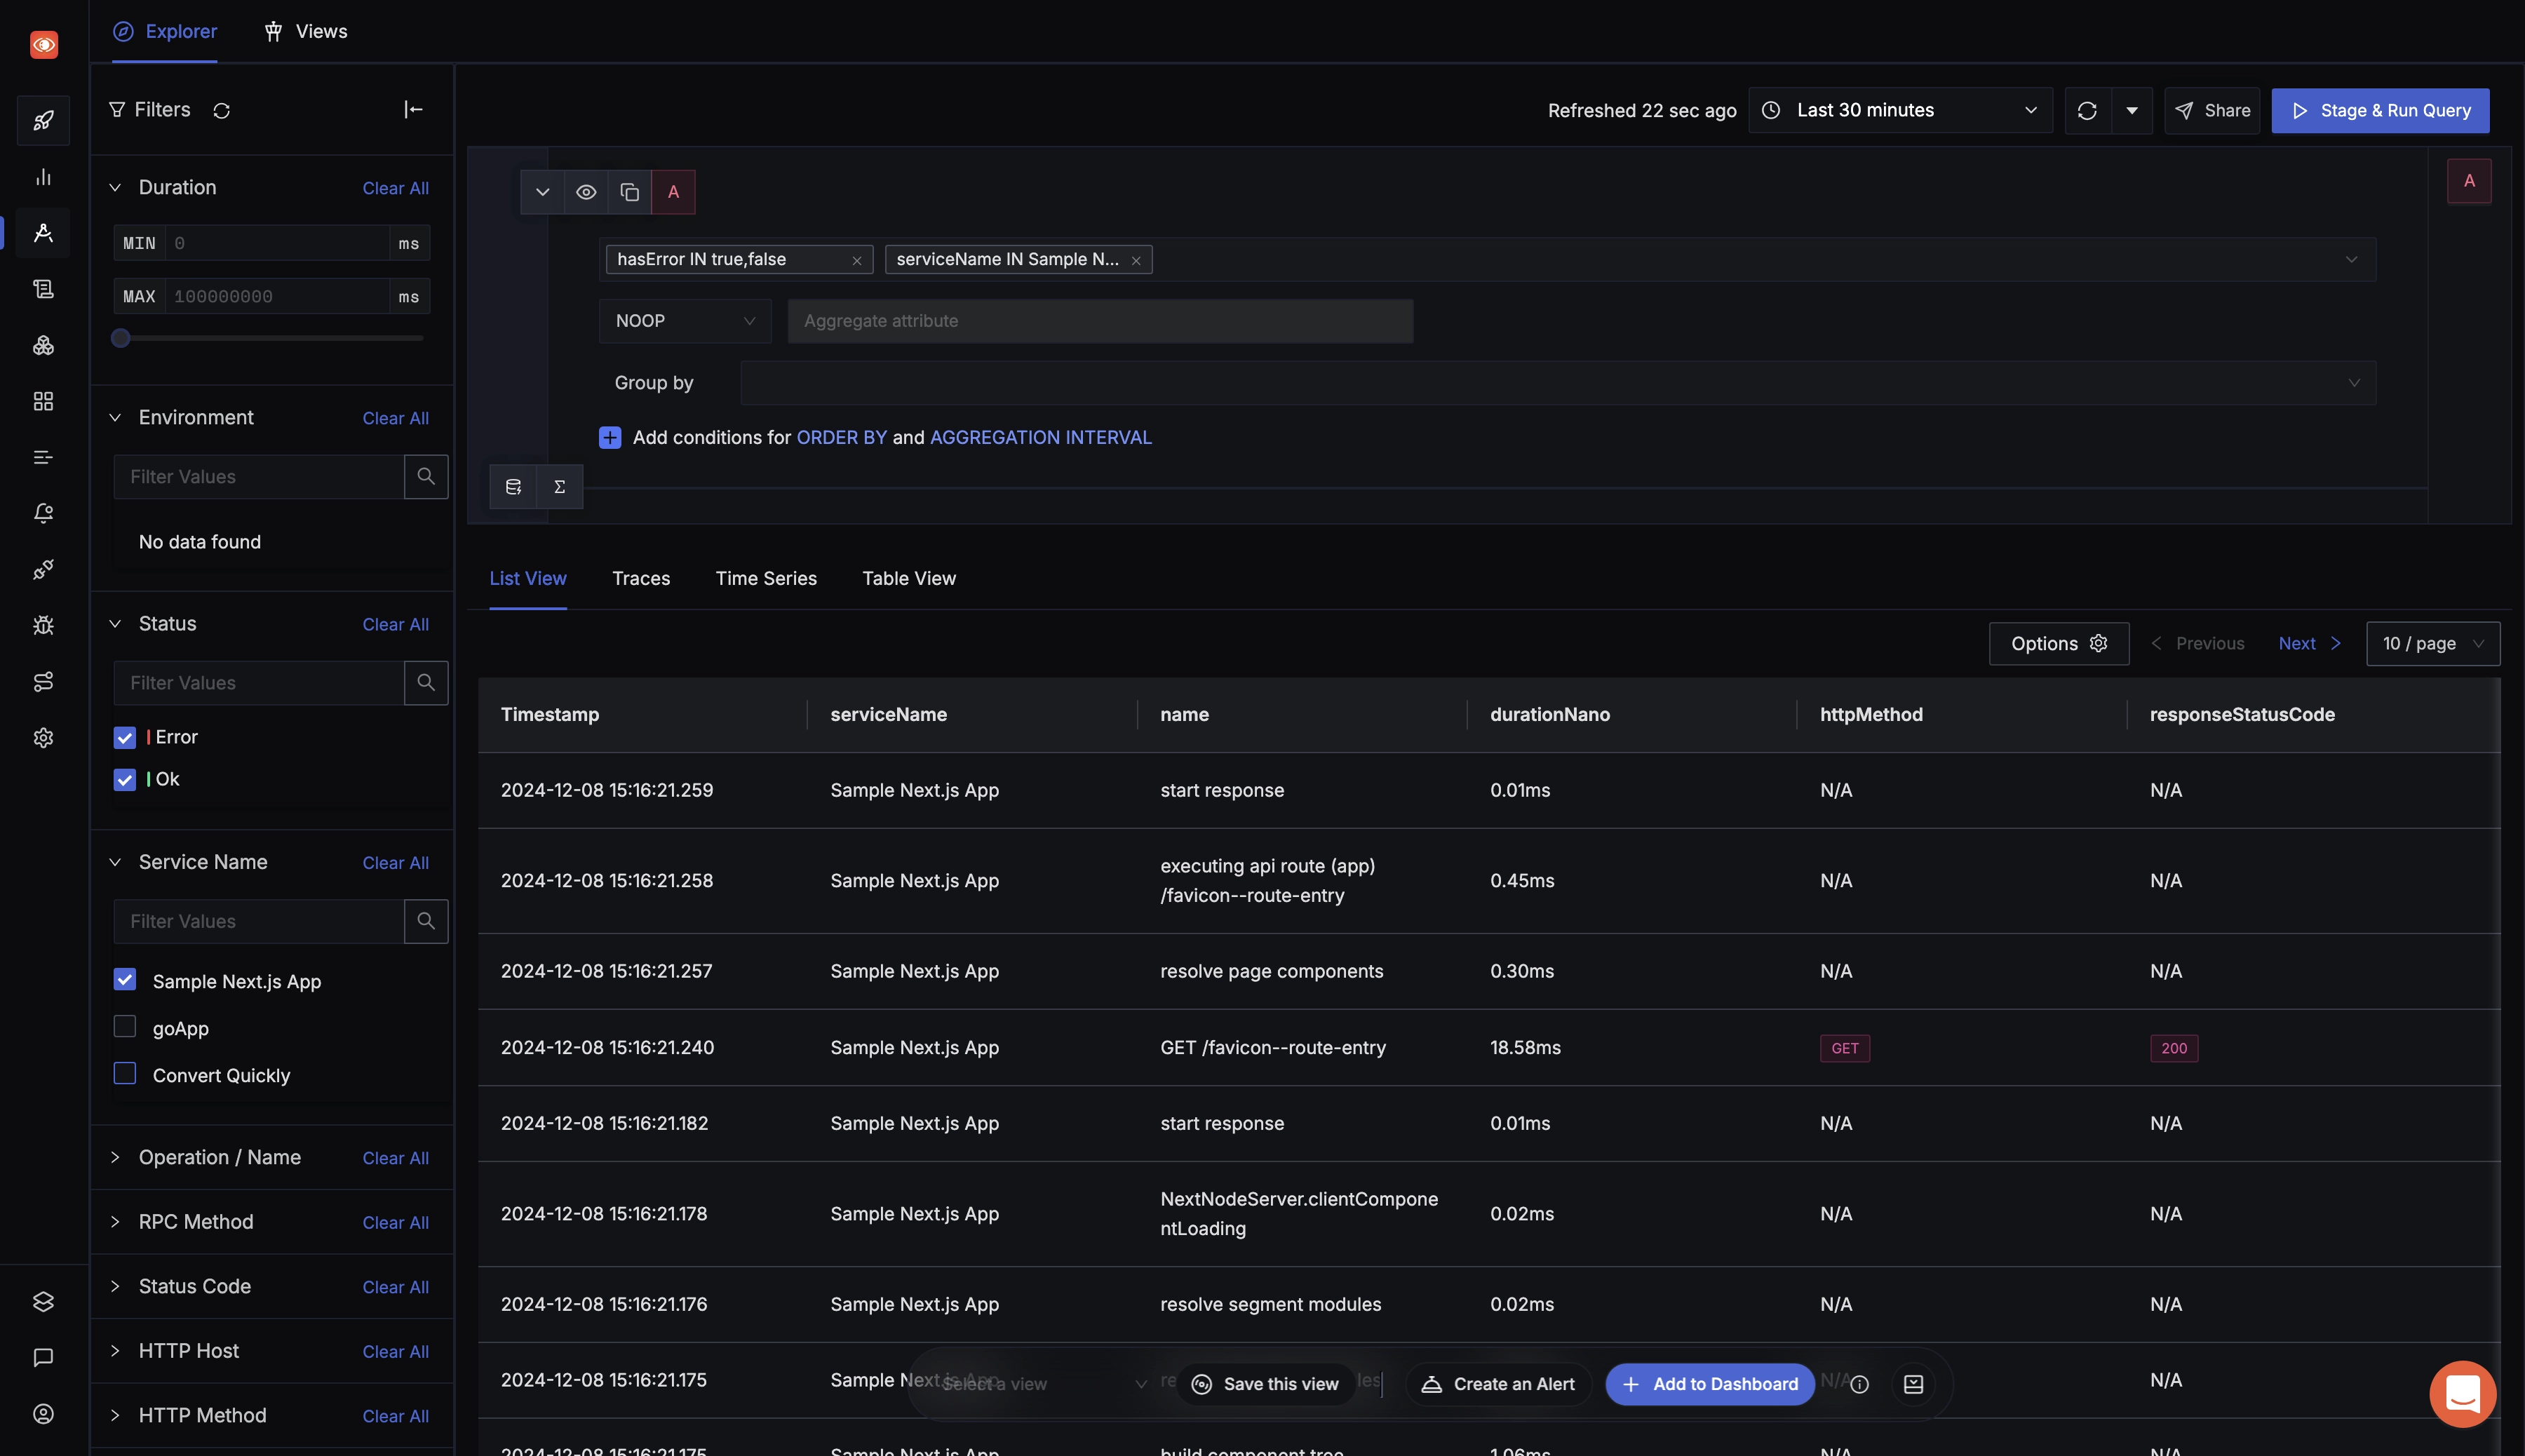
OpenTelemetry also captures tracing data, which is invaluable for visualizing how user requests flow through various services, especially in multi-service architectures. To visualize your application’s tracing data, navigate to the Traces section via the left sidebar of the SigNoz dashboard.
In the Traces tab, you can filter tracing data by tags, status codes, service names, operations, and more. This filtering capability makes it easier to isolate and analyze specific requests or identify performance bottlenecks.
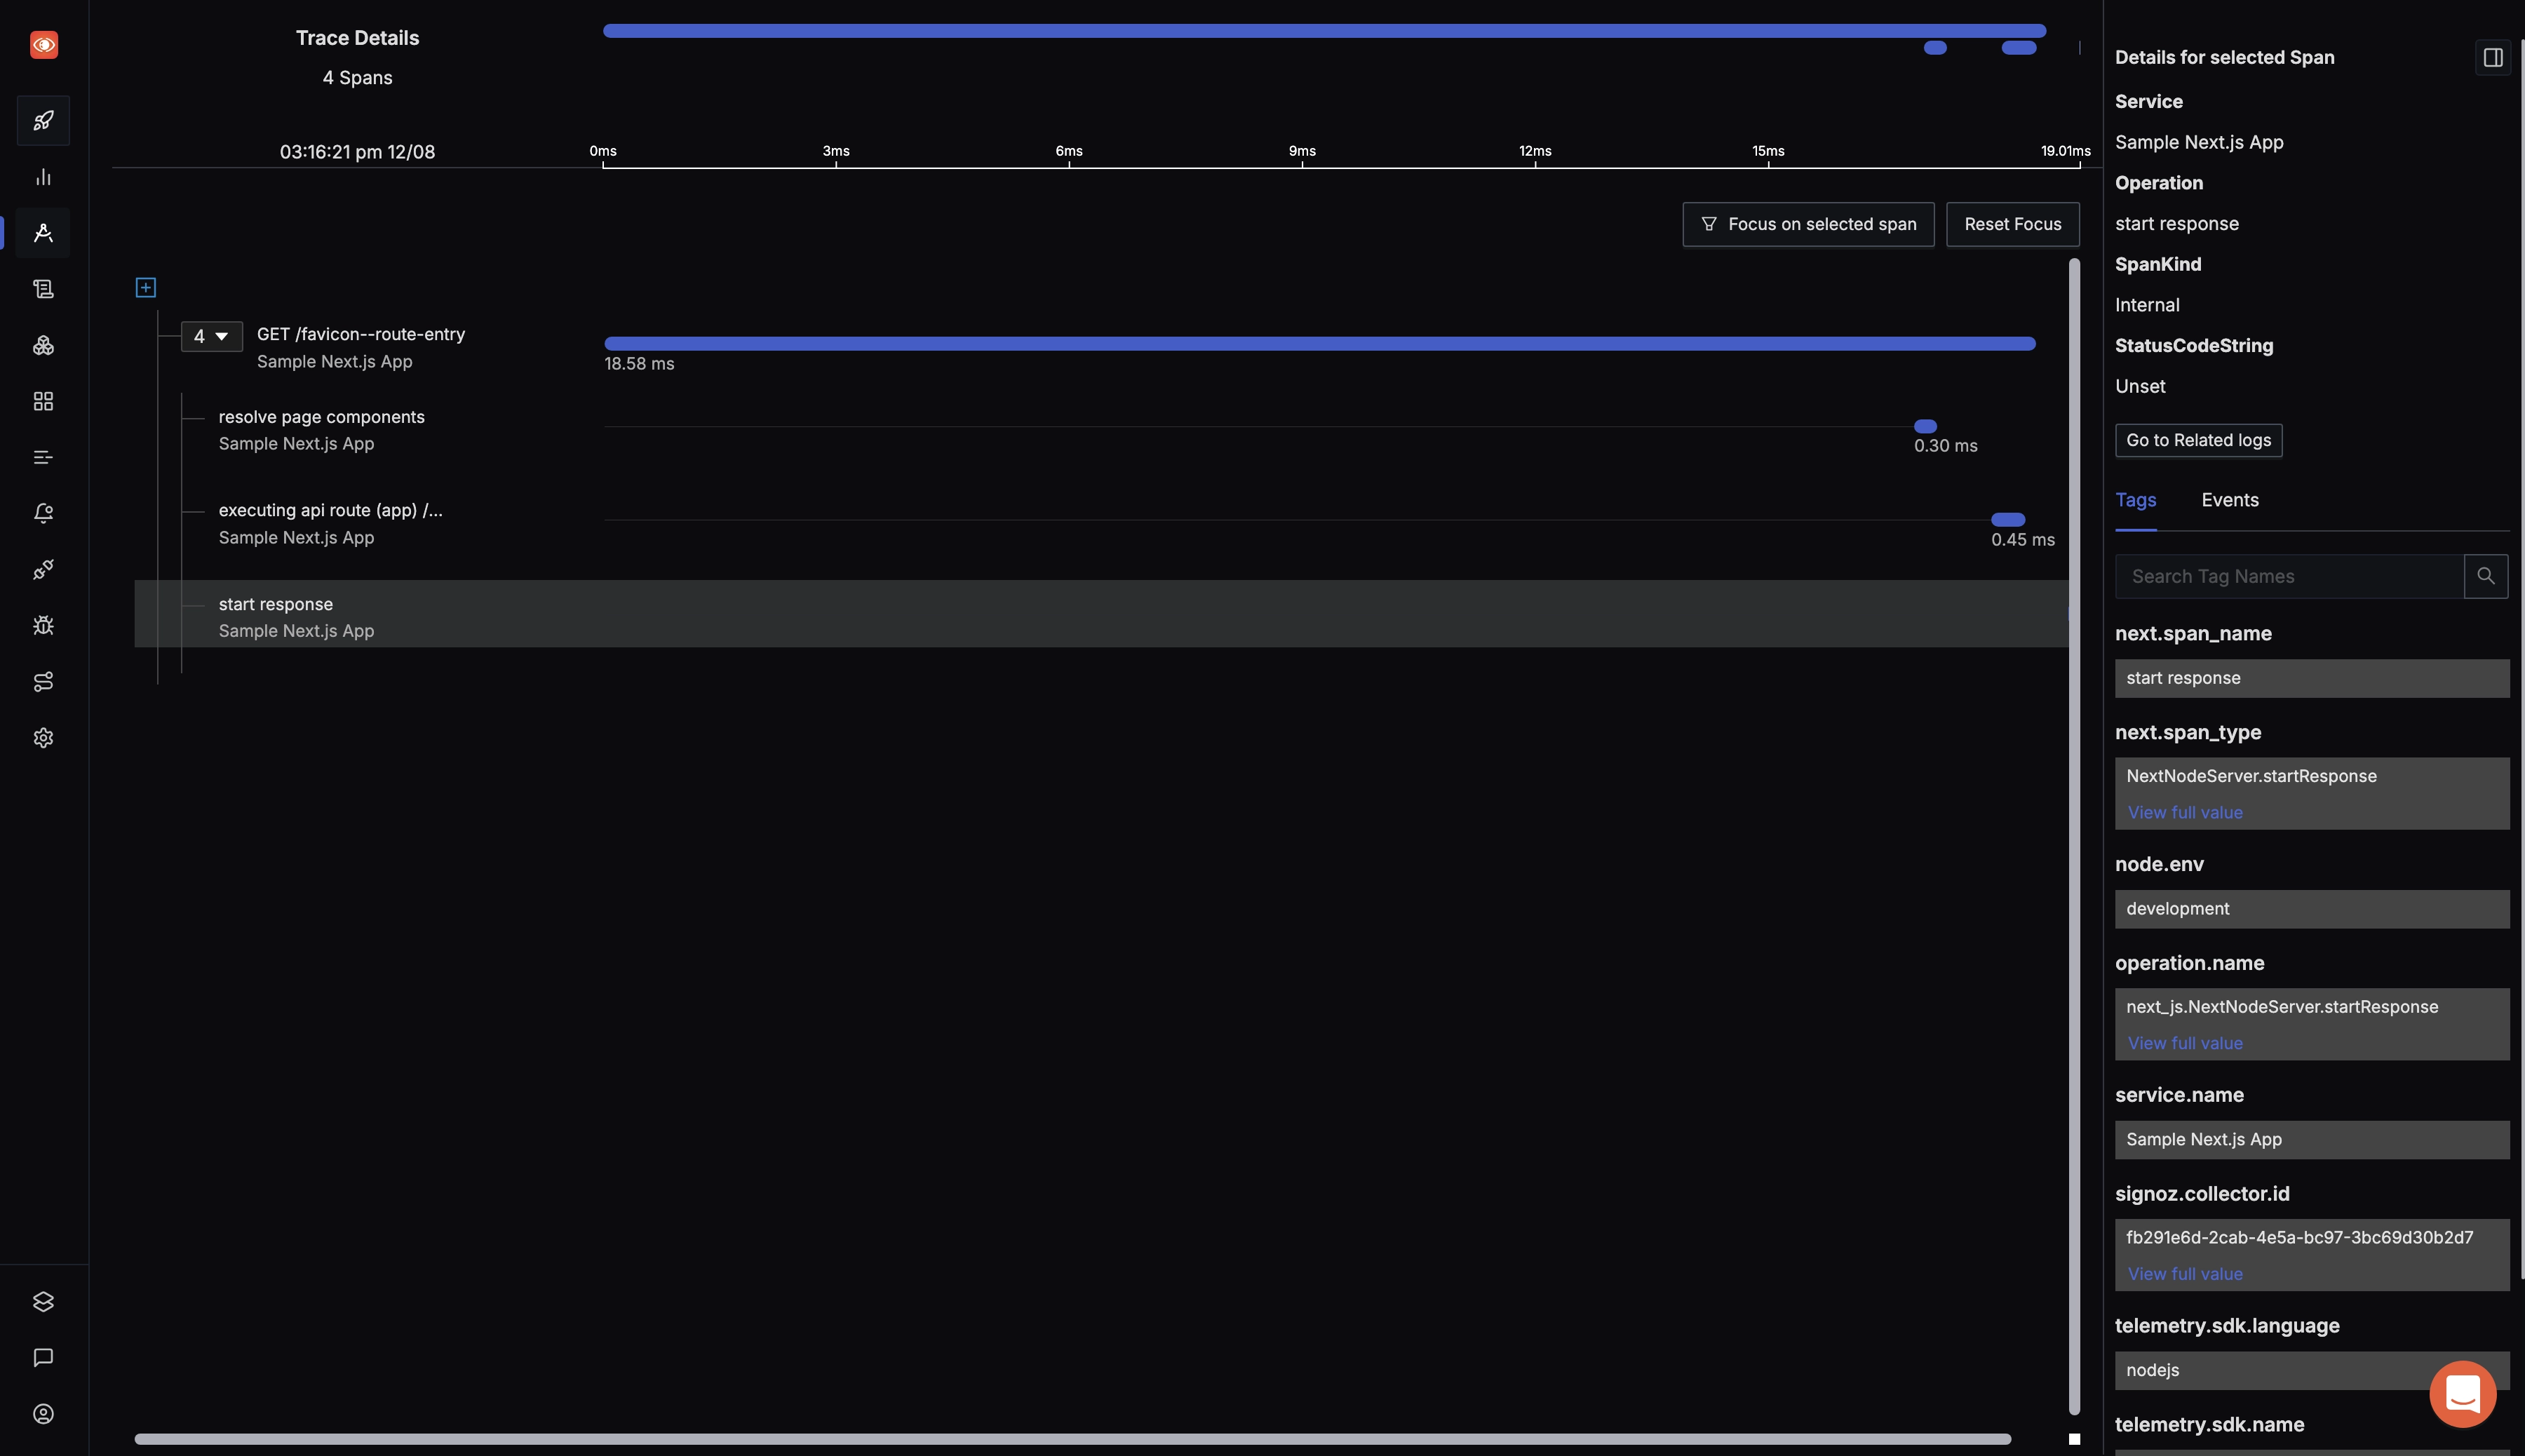
Tracing data can also be visualized using flamegraphs and Gantt charts, which provide a clear picture of how requests are handled across services. These visualizations make it easy to pinpoint inefficiencies and understand the end-to-end performance of your application.
Conclusion
Using OpenTelemetry libraries, you can instrument your Nextjs applications for end-to-end tracing. You can then use an open-source APM tool like SigNoz to ensure the smooth performance of your Nextjs application.
OpenTelemetry is the future for setting up observability for cloud-native apps. It is backed by a huge community and covers a wide variety of technology and frameworks. Using OpenTelemetry, engineering teams can instrument polyglot and distributed applications and be assured about compatibility with a lot of technologies.
SigNoz cloud is the easiest way to run SigNoz. You can sign up here for a free account and get 30 days of unlimited access to all features.
If you face any issues while trying out SigNoz, you can reach out with your questions in #support channel 👇

Further Reading
Implementing OpenTelemetry in Angular application
Monitor your Nodejs application with OpenTelemetry and SigNoz
